
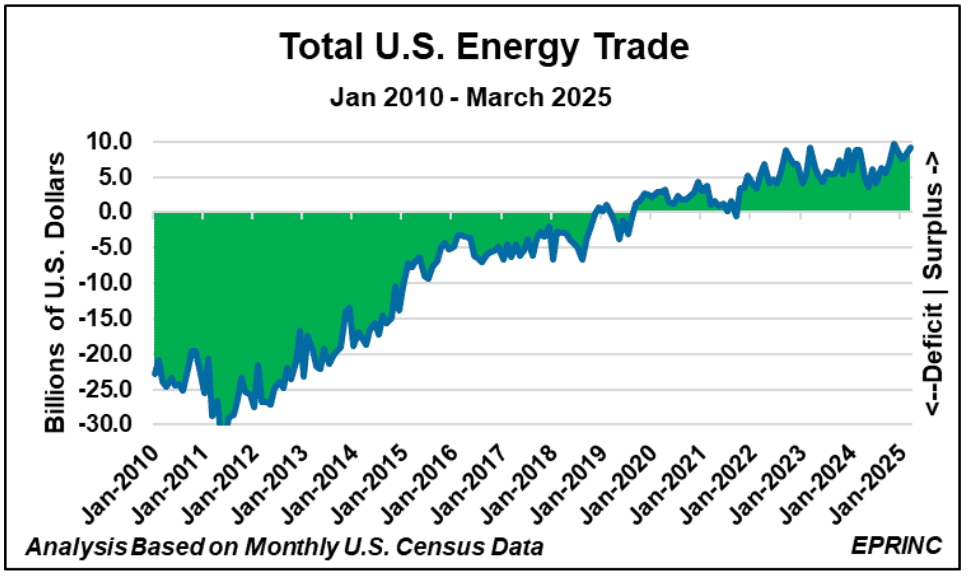
Concern over the effect of energy imports on U.S. trade dates to the late 1950s, when the country moved into persistent negative energy trade imbalances. Efforts to remedy those imbalances contributed to the energy shortages of the 1970s, leaving lasting concerns about future vulnerability. Beginning in the 2000s, however, the application of hydraulic fracturing to shale formations, refined through continued innovation, produced a resurgence in domestic crude oil and natural gas output.
The chart tracks the U.S. energy trade balance and its components on a monthly basis. During 2010 the country reported a monthly deficit of more than $20 billion, which breached $30 billion in 2012. The overall balance began shifting from deficit to surplus in late 2018, and now stands at roughly $9.5 billion in surplus, with the trend continuing upward.
- Natural gas: Hydraulic fracturing shifted the U.S. from net importer to net exporter, moving from a monthly deficit of about $2 billion in 2010 to a surplus now ranging from $3 to $5 billion.
- Petroleum products and gas liquids: The combined balance for gasoline, jet fuel, diesel, propane, and butane has generally been in surplus, rising from about $4 billion monthly in 2012 to roughly $7 billion currently.
- Crude oil: Still in deficit, but the monthly shortfall has narrowed from $18 to $20 billion in 2010 to a current range of $1.5 to $4 billion.
Taken together, these movements illustrate how expanded domestic production has reshaped the energy component of the broader U.S. trade picture.

From the EPRINC Chart of the Week archive.