
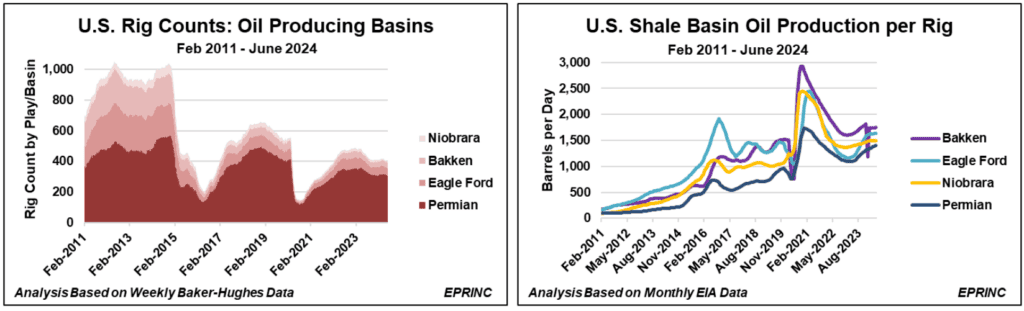
Rig counts have long served as a metric for anticipating shifts in hydrocarbon production. Historically driven by price movements, changes in rig counts often presaged shifts in output, prompting market participants to adjust their near-term expectations. With the development of fracking—the key production technology for shale—rig counts have become less indicative of imminent production changes, while recovery and productivity factors have become more representative.
Shale is a porous rock formation permeated with hydrocarbons; some U.S. formations are endowed with crude oil, others with natural gas. Early production experience yielded recovery factors ranging between 15% and 30% for natural gas, and 3% to 7% for oil owing to its viscosity. Continued improvements in fracking, coupled with increased data acquisition, have raised these recovery factors and, in turn, productivity per well.
The primary shale formations for natural gas are the Utica and Marcellus Shales straddling Eastern Ohio, Western Pennsylvania, and West Virginia—collectively referred to as Appalachia. The primary formation for crude oil is the Permian Basin across West Texas and New Mexico. In the late 2000s, an Appalachian fracked well produced an average of 330 thousand cubic feet per day; by 2024 this had risen to 28.6 million cubic feet per day. Similarly, Permian fracked wells produced an average of 60 barrels per day in 2007, rising to 1,400 barrels per day in 2024.
Some assessments of future production fail to account for these productivity improvements, making no accommodation for innovation. This tends to produce forecasts that are consistently below actual results.


From the EPRINC Chart of the Week archive.