
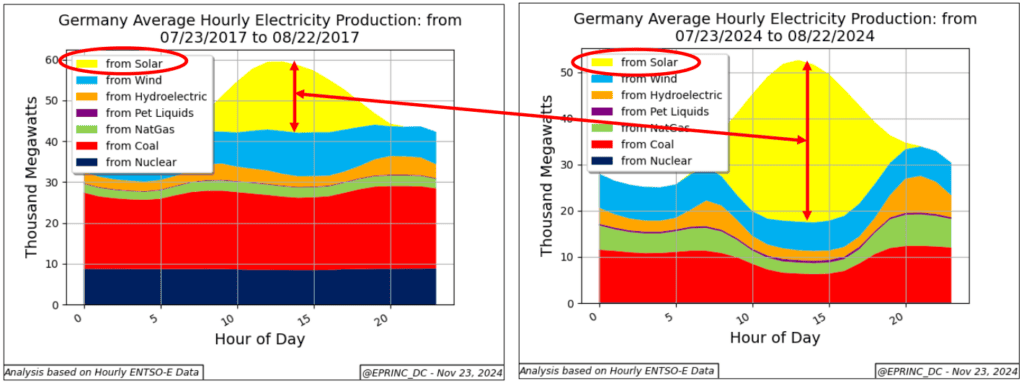
The “Duck Curve” describes the effect of growing reliance on utility-scale solar photovoltaic generation on grid load profiles. First identified in California, the phenomenon appears as a midday bulge in solar output that strongly displaces generation from other sources, notably thermal and hydroelectric. As solar generation has expanded in Europe—in countries such as Germany, Spain, and Italy—the same pattern has emerged there.
This chart compares Germany’s mid-summer electricity generation resource mix in 2017 and 2024. During mid-summer 2024, total power load peaked at 50.5 GW at noon, of which solar provided 11.7 GW. By 8 p.m., net load declined to 45.3 GW, but the drop in solar generation through the late afternoon still required additional power from thermal and hydroelectric resources. From noon to 8 p.m., these sources supplied an average of 5.5 GW—1.6 GW from coal, 1.8 GW from natural gas, and 1.93 GW from hydroelectric.
The comparison also highlights the near-elimination of nuclear power. In the summer of 2017, nuclear plants generated 9 GW; by 2024, that figure had fallen to 200 MW. Following the April 2011 Fukushima accident, German policymakers, with public support, resolved to retire the country’s nuclear plants by 2022.
With the rising unreliability and cost of Germany’s electricity—particularly following Russia’s 2022 escalation of aggression against Ukraine—policymakers debated whether to retain some nuclear capacity, delaying the shutdown of the last three operating units.

From the EPRINC Chart of the Week archive.