
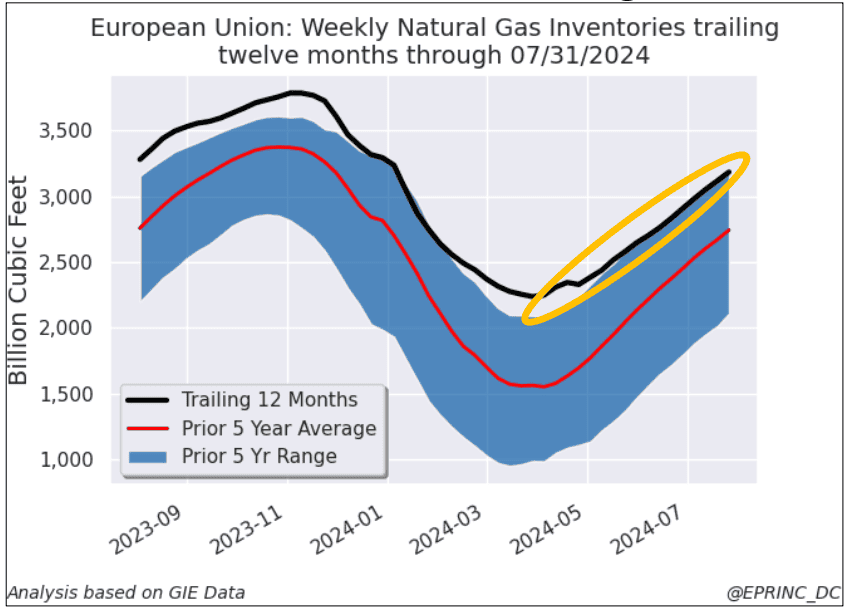
The chart compares natural gas storage levels in the European Union and Ukraine against the trend of previous years. In 2024, the EU has been running inventories well above trend, while Ukraine’s inventories have been running well below trend — a contrasting pattern that reflects the changed calculus of storing gas near an active conflict.
The divergence stems from a combination of factors. EU inventories are high, and Ukraine’s storage facilities have become wartime targets. As a result, Europe’s natural gas traders have been reluctant to store gas in Ukraine during 2024.
The scale of storage differs considerably: the EU holds roughly 3.5 trillion cubic feet (tcf) of natural gas storage capacity, while Ukraine has a total of about 1 tcf, primarily located in the western part of the country.
During the European natural gas shortages of 2022 and 2023, Ukraine’s storage offered an advantage — aggressive summer injections provided a cushion for winter drawdowns. Russia’s war against Ukraine has since made energy infrastructure, including gas storage facilities, vulnerable to attack and damage, altering how that storage is used.


From the EPRINC Chart of the Week archive.