
This Chart of the Week illustrates the long-term reduction in motor vehicle emissions by comparing two versions of the same iconic car: the 1968 Ford Mustang GT featured in the film Bullitt and a 2016 Mustang. The comparison measures emissions of the six “criteria” pollutants regulated under the Clean Air Act — carbon monoxide, lead, ground-level ozone, nitrogen dioxide, particulate matter, and sulfur dioxide — expressed as pounds emitted per 100,000 miles driven. Emissions for each model year were calculated using official EPA data.
The 1968 Mustang produced an estimated 1,500 pounds to one ton of criteria pollutants per 100,000 miles. The 2016 model produces only 10 to 20 pounds over the same distance, a reduction of roughly two orders of magnitude.
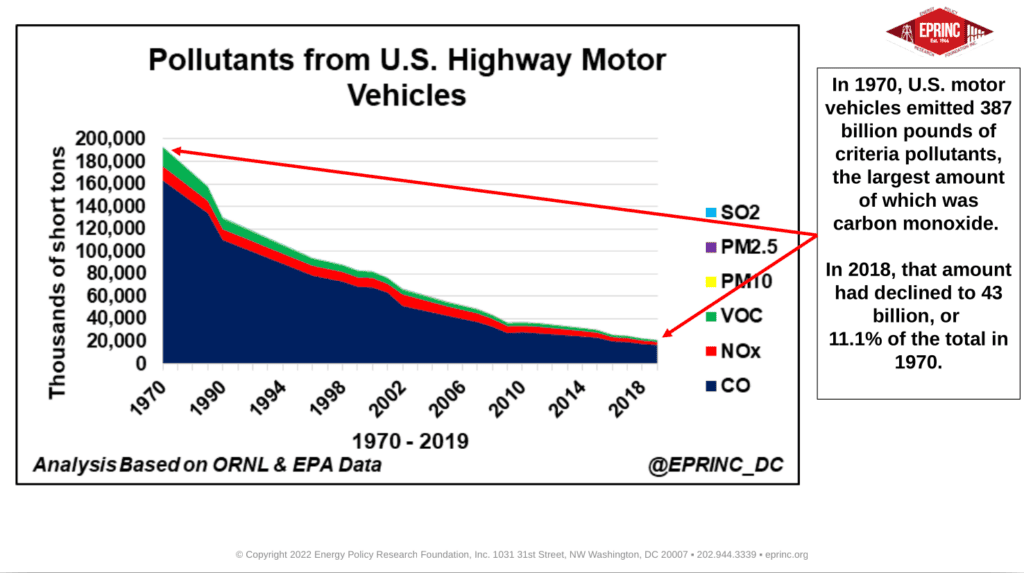
Under the Clean Air Act, EPA sets National Ambient Air Quality Standards establishing maximum allowable concentrations of the six criteria pollutants in outdoor air. The dramatic improvement reflected in the chart underscores the cumulative effect of vehicle emissions standards on the pollution profile of new cars since 1970.


From the EPRINC Chart of the Week archive.