
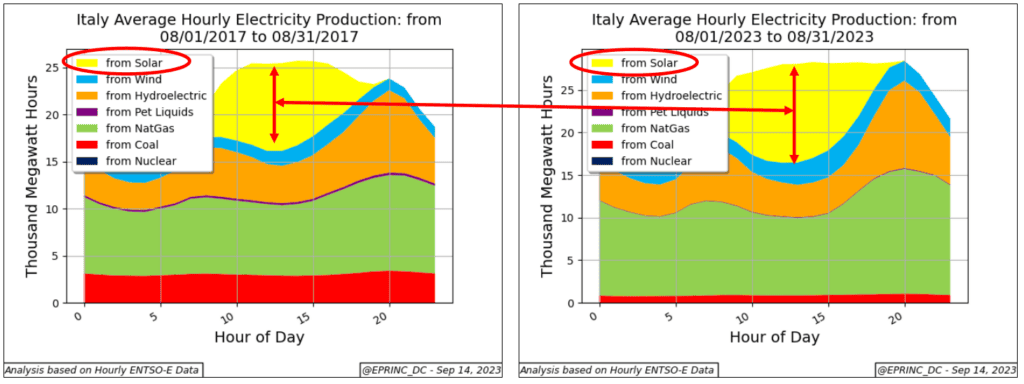
The chart traces the evolution of Italy’s August electricity generation resource mix from 2017 through 2023, capturing the growing share of utility-scale solar photovoltaic output across the country’s grid. Rising reliance on midday solar generation produces a distinctive shape known as the “Duck Curve,” a phenomenon first identified in California, where peak midday summer solar output creates a pronounced bulge that strongly displaces generation from other sources such as natural gas.
The same pattern is now visible in Italy. As solar generation drops off in the late afternoon and power demand climbs into the evening, other generating resources must ramp up quickly to meet the shortfall. During August 2023, Italy’s grid required a ramp of nearly 10,000 megawatts between 2 p.m. and 8 p.m.—roughly 27 megawatts per minute.
To meet this steep and reliable load requirement, Italy draws on a combination of natural gas and hydroelectric generation, both of which can respond rapidly. The chart underscores how the growth of intermittent solar capacity raises the importance of flexible, dispatchable resources capable of managing the daily transition from midday surplus to evening demand.

From the EPRINC Chart of the Week archive.