
Crude oil import dependence has long served as a gauge of U.S. energy security, whether measured by volume, in proportion to domestic production, or by the source and concentration of supply. Energy security is commonly evaluated along three dimensions—availability, affordability, and sustainability—with availability resting on both domestic production and imports. Imports, in turn, are assessed by their size and by how concentrated or diffuse their sources are.
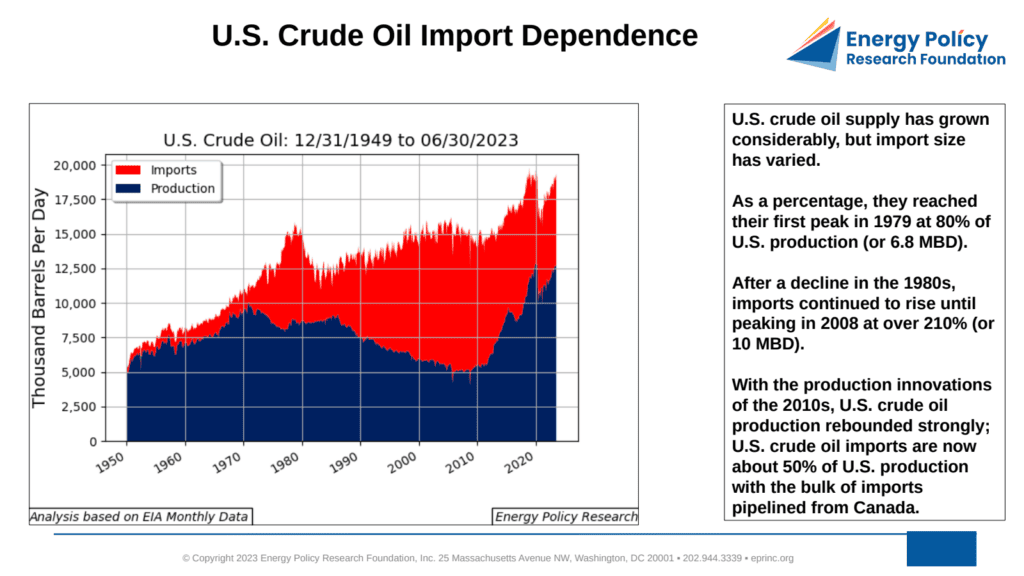
Largely self-sufficient through 1948, the United States saw imports rise through the 1950s, climbing from 9% of total domestic production (485 thousand barrels per day) in 1950 to 23.5% (2.2 million barrels per day) by 1973. These barrels came from large, concentrated reserves that U.S. refiners could import at a significant cost advantage over domestic supply, raising concern among policymakers about the exposure of the American economy.
As a share of domestic production, imports first peaked in 1979 at 80% (6.8 MBD). After a decline in the 1980s, they resumed rising and peaked in 2008 at over 210% (10 MBD). The production innovations of the 2010s reversed that trend: domestic crude output rebounded strongly, and imports now stand at about 50% of production, with the bulk pipelined from Canada.
Policy responses evolved alongside these shifts. After two programs aimed at fixing import levels—the 1957 Voluntary Oil Imports Program and the 1959 Mandatory Oil Import Quota Program—Congress authorized the Strategic Petroleum Reserve in 1975, shortly after the 1973 Arab oil embargo. Rather than constrain imports directly, lawmakers recognized that imports would remain necessary and that other mechanisms were needed to address major supply disruptions.
Three developments have since worked together to mitigate import vulnerability: increased domestic production driven by improvements in oil and natural gas technology, the establishment and maintenance of the Strategic Petroleum Reserve, and diversification of import sources—now weighted more toward Canada and Mexico and less toward other countries.

From the EPRINC Chart of the Week archive.